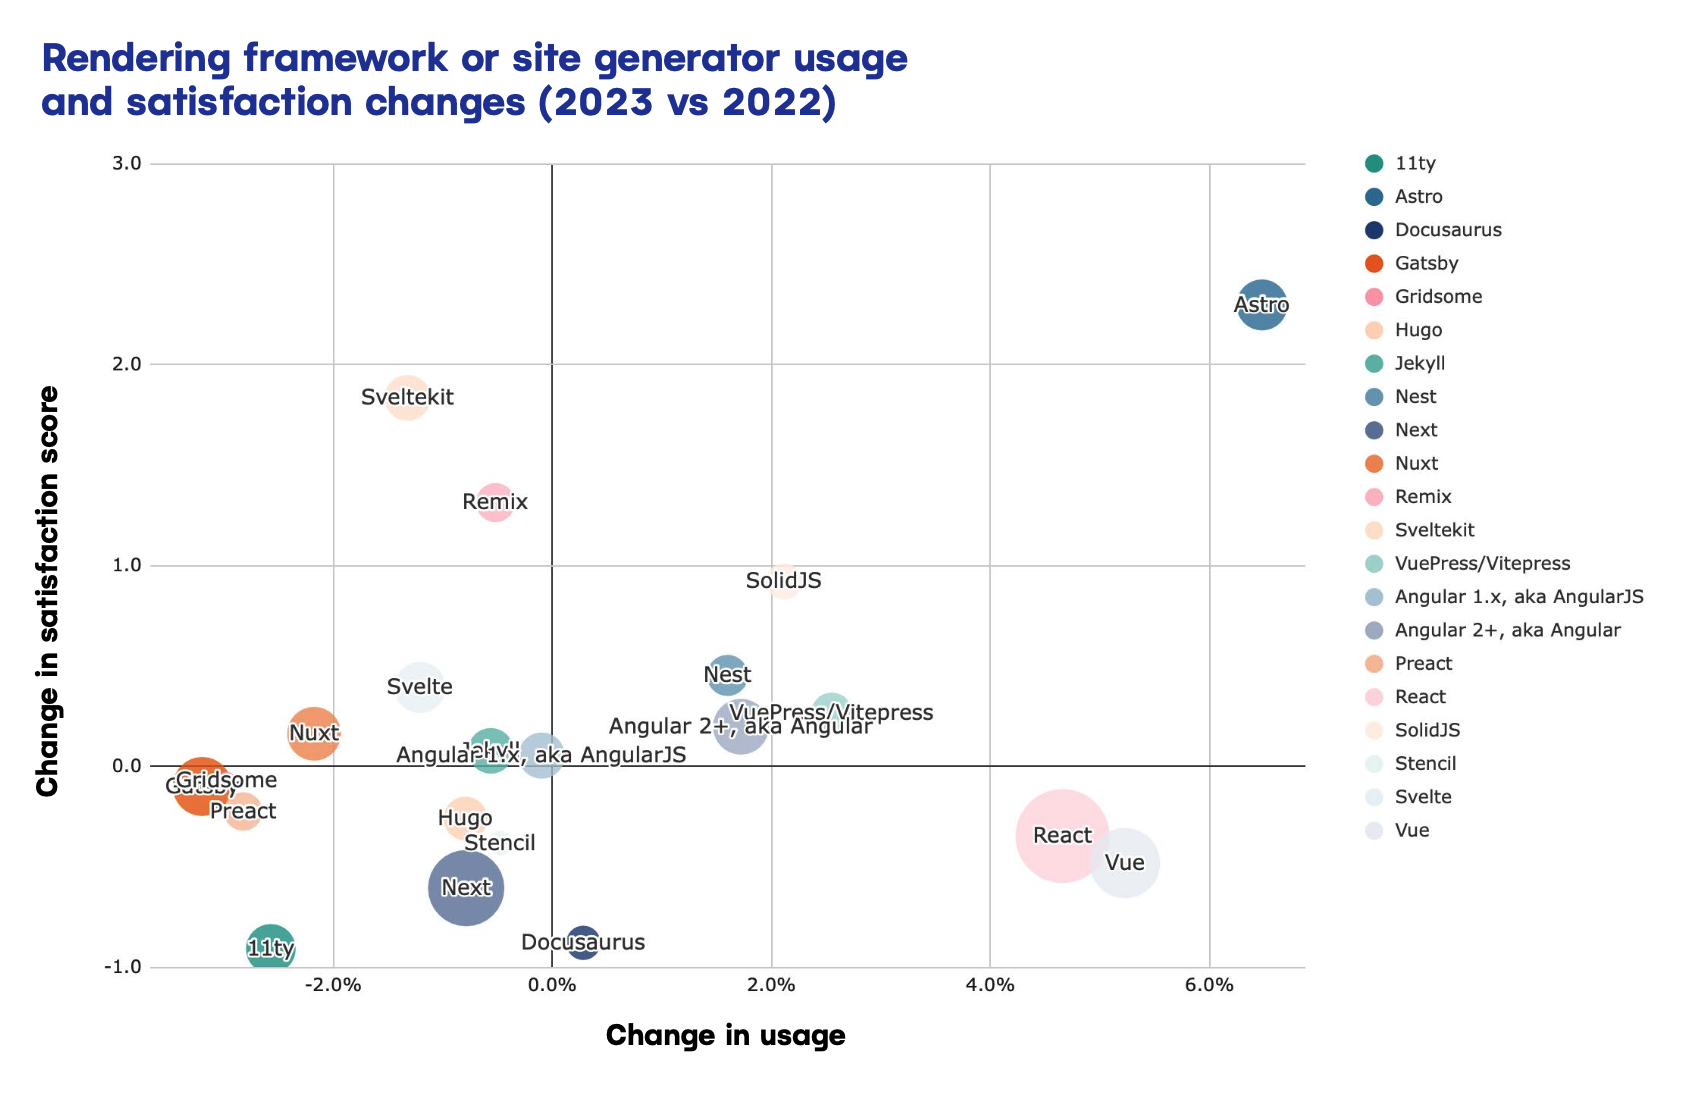
Alright, this graph from Netlify’s “State of the Web” survey is… intellectually dishonest. And I have to weigh in on it now because a few folks have been making some *specious* assumptions and tagging me 😬
I get it: Netlify wants to highlight graphs that make Next.js look bad but c’mon—leave me out of it.
(I also understand that their resident statistics person departed the company so… it’s unlikely that this was malicious)
🧵🔽
 Zach Leatherman 2929 replies 2424 likes99 reposts Original on Mastodon
29 replies
@zachleat thread broke 😞
@cferdinandi I wanted to change it a bit, sorry!
@zachleat no worries! I also saw some edits happen in real time which was wild!
Continually delighted at 11ty success!
@cferdinandi thanks Chris 🙌
This chart has the absolute numbers (conveniently unordered, though 😬)
Next.js is tied for positive/negative sentiment ratings at #3 with SolidStart and Remix.
Eleventy is tied for #6 overall (alongside Nuxt).
Importantly: Eleventy is *still* punching far above its weight despite the Netlify-induced setbacks we faced this year.
Many of the frameworks listed are VC-funded with multiple full-time developers. We don’t have that—intentionally. Our project goals are different.
As I’ve said before: Eleventy and Astro are allies in the web development framework melee. When Astro wins, Eleventy wins too. It isn’t a zero-sum game.
(and I hope Astro dethrones Next.js too)
@zachleat Next.js is only ‘at the top’ if you’re on Twitter or believe the marketing. It’s far from the most popular framework
@benschwarz yeah, absolutely.
@zachleat sorry, I know you know that and I was speaking at you—feverishly in agreement 😜
@zachleat One more thought before I sign off: I’m very interested to read the (afaict) absent methodology document that was historically included alongside the survey, documenting sources of data and margins of error.
Here’s the one from 2022: https://jamstack.org/survey/2022/community-survey-2022-methodology.pdf
I’m sure it will arrive shortly!
Am I done with this thread? Apparently not. 😅
Here’s what an intellectually honest version of the Netlify State of the Web chart looks like (and this one doesn’t obscure Gatsby)
@zachleat it's hard to see what argument is the best to convince enterprise away from Next.js :/
@scrwd enterprises are often the slowest movers in the space, the ever given still obstructing the suez canal 😅
@scrwd one more thought here: the best evidence is *Gatsby* and the very risky, tenuous relationship that frameworks have with VC investment. Enterprises hate risk—and not even Next’s success can survive the end of the runway
@zachleat The fact that the original report didn't even include a chart like this is wild. Year-to-year growth is a very different metric than overall usage/satisfaction. Younger projects will inherently see more initial growth. A more objective framing would have contextualized the original chart against the absolute numbers.
I'm sorry folks are drawing the wrong conclusions about Eleventy from the report. This isn't a competition—framework monoculture is *always* bad for the web.
@nmoo Page 10 (of 13) of the primary report had the original chart (alone). The second chart showing absolute numbers for sentiment was buried in the appendices on Page 32 (of 39).
(And I *really* appreciate you for saying this)
@zachleat Oh yeah, that's a very different story. Showing only annual % change in a popularity contest is very unusual choice indeed.
If they wanted to show change while also respecting actual values, each of those bubbles in your chart could have a tail extending from last year's position.
@zachleat can you expand on that point? Are Astro and Eleventy related?
@xavdid Astro and Eleventy share the same zero JavaScript footprint vision for the web. Astro devs have said that Eleventy inspired their project from the beginning!
A few key differentiators:
1. We didn’t take VC funding: we’re in it for the long haul.
2. They are bundler-first and Vite-based, which is great but has build performance costs. Eleventy is faster because we don’t bundle a bundler.A few more:
* https://www.zachleat.com/web/site-generator-review/
* https://www.11ty.dev/docs/performance/
* https://www.11ty.dev/blog/newstack/
-
@d well said
@zachleat I love how you think about this stuff. Thanks for being such a positive force, it cant be easy. ❤️
@lofi appreciate you! I’m really just trying to do the right thing even when it’s the hard thing ❤️
@zachleat I’m out of the loop, and a search was no help — what were the Netlify-induced setbacks?
@zachleat TIL solidstart is a thing.
Welcoming offers on https://www.solidstart.info/!